Balance Sheet
Reflects the economic and financial situation on a certain moment.
Patrimonial masses:
- Asset: goods and collection rights
- Fixed/Non-Current Assets: remain for more than one year (fixed assets, al/p investments, deferred tax assets...)
- Current/Current Assets: they can be liquidated in less than a year (inventories, balances receivable, cash...)
- Equity and liabilities: Sources of funding
- Fixed/Non-Current Liabilities: long-term debts and obligations, more than one year (al/p debts, deferred tax liabilities, al/p provisions...)
- Current/Current Liabilities: short-term debts and obligations, less than one year (ac/p debts, creditors, ac/p provisions...)
Within the Balance Sheet, you can differentiate between the balances operational, those that are directly part of the development of the business (impact the operational part of the P&G account) and the non-operational, which depend on the financial management of the company (they affect the non-operating part of the P&G account).
P&G
It reflects the evolution of accounting profit of a company during a given period of time.
Important: follow the accrual basis, not cash basis. That is, it is imputed in the fiscal year in which it occurs, regardless of collection or payment.
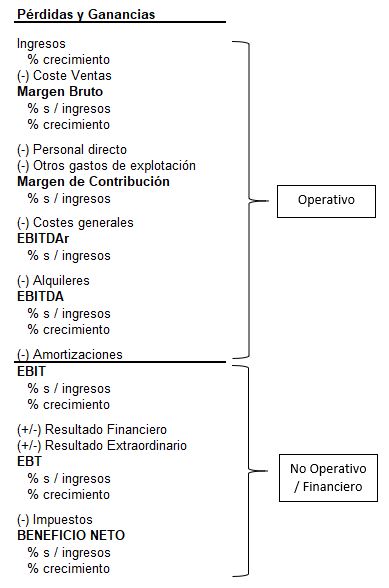
It is necessary to differentiate and analyze the operational management (up to EBIT) and Financial management (from EBIT to BN) of the company.
If we look directly at the last line, the BN, we could rush to conclude that one company is more profitable than another, when it may be equally profitable operationally but what differentiates it is a lower level of debt or better financial management (less % interest rate at which it is financed).
P&G Keys – Operational Part:
- A Gross margin high (>40%) and recurring indicates that the business is very good and/or has some competitive advantage. A low Gross Margin (<20%) indicates high competitive pressure. Study the evolution of the % of the Gross Margin on sales to analyze supply management.
- He EBITDAr It is a measure that is used when rental expenses are relevant, such as in the hotel or restaurant sectors. It allows you to obtain a vision of the business excluding elements that are not directly related to the main activity, such as rentals.
- He EBITDA It is the first measure of operational profitability. must see linked to maintenance CAPEX to see the investment required to obtain that EBITDA. Analyze the evolution of EBITDA growth and EBITDA margin, as well as compare with your sector.
- He EBIT It is the second measure of operational profitability. Easier to manipulate than EBITDA because it depends on the company's amortization policy. Analyze the evolution of EBIT growth and EBIT margin, as well as compare with your sector.
- Both EBITDA and EBIT They are different from the box. In the P&G account, investments in CAPEX and in Working Capital.
P&G Keys – Non-Operating Part:
- Type of interest to which it is financed: Financial Expenses / Average debt
- To calculate the taxes What you pay, you have to multiply the Tax Base by the Corporate Tax (25% in Spain). The effective Tax Base is not the same as the EBT because there are deductible expenses that allow you to pay less taxes.
P&G Keys – Net Profit:
- BPA (Earnings per share) or EPS (Earnings per share) = BN / No. of shares in circulation. Widely used in the US, it allows you to see the effect of share repurchases.
- Analyze whether the benefits are stable or cyclical over time.
- Analyze the evolution of profit growth (be careful with extraordinary ones that are not recurring) and 1TP3Q on sales.
Cash flow
Collect all the cash inflows (collections) and outflows (payments) of a company during a given period.
Cash Flow vs P&L: Income and expenses (P&L) are NOT the same as receipts/collections and outflows/payments of money (Cash Flow).
Some examples: i) sales accrual period (income is allocated to P&G in the year in which the sale is made, even if it has not yet been collected); ii) amortization (affects P&G but is not a item of box); iii) investment in CAPEX (affects Cash Flow, but not P&L).
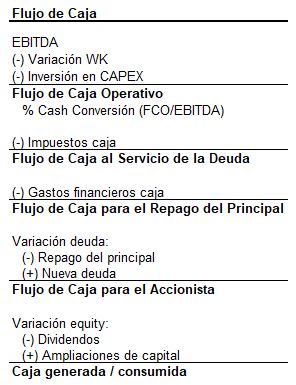
The main investments are:
1.Total CAPEX = maintenance CAPEX + expansion CAPEX
- Maintenance (replacement investment): necessary investment in operational assets to maintain the same current sales level. It should be similar to amortization.
- Expansion: necessary investment in operational assets to increase the current level of sales. It should be aligned with the company's growth plan.
2. Working Capital o Operating Maneuver Fund: short-term operating assets and liabilities directly related to the company's activity.
- The main ones are Customers (+), Inventories (+) and Suppliers (-).
- Analyze the average collection, payment and stock rotation periods, with the optimal situation (from a financial point of view) being the shortest possible collection period and the longest possible payment period, thus obtaining financing. free.”
The cash register is the most important Financial Statement, it cannot be manipulated.
Portfolio Manager

